The Canvas view enables users to visualize an existing schedule and plan visually by interacting with the schedule in a 2D diagram. We built Canvas so that users can understand, trust, and confidently interact with their imported schedules.
This article deals specifically with the Visual Planning components of the Canvas view. To learn more about how modify tasks in the table view (the left panel of the Canvas), go to the Plan Page article.
Table of Contents
- Getting Started
- Create your Canvas
- Canvas Navigation + Visualization Settings
- Color Coding
- Working with Blocks
- Timelapse View
- Drawing Upload Details
- Export to PDF
Getting Started
To switch from the Gantt view to the Canvas view, go to Plan and then click the Canvas tab on top of the screen.
Customize your view:
By default the Canvas view will show you a split view with the Gantt on the left and Canvas on the right.
- Click Hide table to maximize the Canvas view.
- Click Show table to bring back the split view
- Hover your mouse over the dividing line in split view and click to drag left or right to control how much of the screen shows Gantt versus Canvas.
Create your Canvas
1. Upload image(s) by clicking the icon on the bottom of the screen. You can skip this step if you don't want to upload a background image.
2. Populate your canvas with blocks.
There are three ways that blocks can be generated:
- Automatically generate the blocks by WBS level or custom property
- Automatically generate blocks based on markups in the uploaded pdf.
- Manually generate by drawing the blocks onto the diagram.
Automatic block creation from WBS or custom property:
To automatically create a canvas and populate it with blocks based on an uploaded schedule, click Visualize schedule along the bottom of the screen.
After you click Visualize, you will see a block creation dialogue screen.
Visualize by: WBS, custom property, or tasks.
If you visualize by WBS, you can choose which level.
If you visualize by custom property, select the custom property.
Layout options: left to right, right to left, top to bottom, or bottom to top. We recommend left to right for linear projects, and top to bottom for vertical projects.
Automatic block generation from uploaded PDF markups:
If you upload a pdf drawing that has markups, you will see a prompt to optionally auto-generate blocks from the markups.
Manual Block and Text Creation:
Along the bottom of the screen you will see the following icons.
The shape icons - square, circle and triangle - allow you to create blocks of that shape.
The irregular shaped icon allows you to draw a custom shape - this can be used to create a block that perfectly overlays a shape in your uploaded drawings.
The T icon allows you to create a text block and input text.
The portrait image on the right allows you to import a drawing as image or PDF.
Canvas Navigation + Visualization Settings
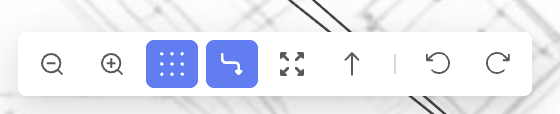
Magnifying glasses to zoom in or out.
Toggle to snap shapes to a grid or drag them to any desired orientation.
Toggle to show or hide dependency arrows.
Toggle to expand or collapse all WBS levels on the Gantt view
All toggles appear as blue when enabled, and white when disabled.Scroll to top of Gantt chart
Undo or Redo your most recent actions.
Additional Navigation:
Ctrl + wheel: zoom in or zoom out the space
Double left click on the canvas: zoom in
Pan with wheel / right click: move the space
Window selection / Ctrl + left click: multiple elements selection
Canvas Visualization Settings
Click the cog icon in the filter bar to control how data is visualized on the canvas.
Users can choose to show duration on the blocks in calendars day or workdays, and can choose to show or hide the start and finish dates.
If the blocks represent many tasks, the data displayed will be inclusive of all tasks assigned to that block.
Color Coding
Users can automatically color code blocks by assigned crew, equipment or materials. Blocks can also be color coded by task completion status (not started, in progress, complete).
To color code, click the color coding menu in the lower right corner of the Canvas:
Next, select the category by which you want to color code:
ALICE will automatically choose colors for each group. You can customize which colors are assigned to which resources within the resource tab.
Working with Blocks
You can also adjust a block's order by selecting Bring to Front or Send to Back and customize the block's color.
Once the block is created, it is possible to adjust the block size by dragging its corners. Multiple blocks can be also resized simultaneously.
By right clicking on the block it is possible to do the following actions:
Properties: You can update the block name, make the text size larger or smaller, change its shape or color, or modify its order. You can apply bulk updates to multiple blocks by selecting several at once.
Duplicate: Use this functionality to duplicate selected block(s) and text. Blocks and text can be also duplicated by selecting them and clicking the duplicate icon in the bottom right corner.
When duplicating blocks with the tied activities that are described in the next chapter, you can choose if ALICE should also duplicate the tasks and relationships associated with those blocks.
Remove: Use this functionality to remove the block(s). Blocks and text can be also deleted by selecting them and clicking the bin icon in the bottom right corner or by pressing the delete key on the keyboard.
When removing blocks with the tied activities that are described in the next chapter, it is possible to delete just the block or delete the block along with the tasks tied to it by checking the box.
Tying activities to blocks
Select activities or WBS level(s) and assign them to the desired block by right clicking on selected elements in the list and selecting Tie to block under the Visualize Schedule submenu, then select the block to which selected activities should be tied. Selected activities can be also assigned to the block by using the Tie to block icon in the upper left corner.
The block name will be automatically assigned to the selected activities in the Block column, helping to organize and control which activities belong to each block. If you need to detach specific activities from the block, simply select them and right-click to choose the Untie from Block option under the Visualize Schedule submenu.
Blocks with tied activities will display a symbol in the bottom right corner. To select all activities linked to a block at once, click the block and use the Select All Tied option in the bottom left corner of the screen, or right-click the block and choose Select All Tied from the context menu.
Block Relationships
Task precedence arrows can be shown on the canvas.
When you autogenerate blocks, task dependency arrows will be autogenerated based on the task dependencies in the schedule. Double-click on the autogenerated arrows to review the relationships between tasks assigned to the blocks. If needed, remove the relationship, for example, if it represents preferential logic and is not required.
If no task dependencies exist between two blocks, but you would like to add task dependencies to ensure that one block is completed before the other, select a block and drag its edge dot to the edge dot of the other block. ALICE will give you a preview of the task dependencies it would add to translate the block sequence you’ve drawn to the schedule. You will have the option to modify and accept the changes.
Selection & Filtering
Tied tasks selection and filtering
To select or filter all tied activities to the block(s), select the block(s) and right click on them, then select the function select all tied.
Blocks Filtering
To filter specific spatial block(s), use the Select to Filter feature and choose the desired block from the list under the Block tab.
Blocks can be also filtered by start and end date that can be defined at the top next to the Select to filter functionality. Blocks that have tied tasks happening during the selected timeline will be filtered to respect the dates filtering.
Blocks matching the filter selection will be displayed in full color, while non-matching blocks will remain visible but with 20% opacity. Other filters (by tasks, crews, etc.) affect the blocks in the same manner.
Timelapse
The Timelapse feature provides a dynamic and animated representation of construction schedule and will help to understand what is happening and when. Timelapse is implemented in the separate view, which can be found as a tab along the top of the page.
Once in the Timelapse view, a slider will appear at the bottom, where it is possible to select the time interval (Month, Week, Day, etc.) and click the Play button to run the sequence or use the arrows to manually review progress. The timelapse view is also available on the Analyze page for generated schedules.
The current and end dates are displayed on the right side of the timelapse. Completed blocks will remain visible on the screen with the reduced opacity.
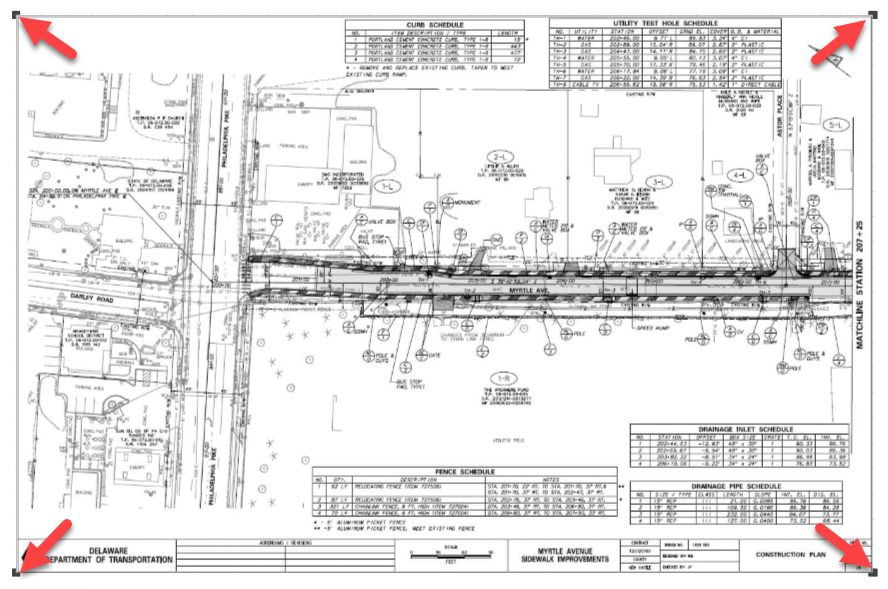
Drawing Upload Details
One or many drawings may be uploaded to your canvas. The following formats are supported: PNG, JPG, SVG, PDF. If uploading a multi-page PDF, ALICE will import up to the first 10 pages of the document.
Once the drawing is uploaded, you can adjust the drawing size by dragging its corners. Multiple drawings and even multiple different instances (drawings, blocks, texts) can be resized simultaneously.
To prevent moving the uploaded image inadvertently, you may right click the image and select "Lock". Locked images cannot be moved, resized or deleted. Locked images may be unlocked by right clicking.
Export to PDF
Your Canvas can be exported to PDF. Click on the Export icon at the top right corner and select the PDF file (.pdf), then choose the appropriate paper size and continue with the Print Preview.